Respirator mask leakage caused by environmental aerosol penetration
- 2020-10-31
- 838
- Esky Purify
(i) -Inspection setup and equipment
(ii) -Test procedure
(iii) -Results, conclusions
(The test results show that the fitness factor is a function of particle size for three different aerosol particle size distributions and for the fitness factor values calculated by each of the two methods. The fitness factors for each aerosol distribution were concentrated around 100 and 400. Due to the different variables in the test setup, the fitness factor for each test is not related to the other tests and should be considered separately. The fit factor is calculated by dividing the total number of particles outside the respirator for each particle size by the total number of particles inside the respirator for the same particle size. Therefore, if the SMPS system detects a particle count of 4 particles per cubic centimetre in the 0.05 μm-0.06 μm size range inside the respirator, and a particle count of 400 particles per cubic centimetre outside the respirator in the same size range, the fitness factor is calculated to be 100. The first ambient aerosol distribution consists of relatively small particles, with peaks in the range of 0.08 μm. micrometers or so. The ambient aerosol distribution has a sufficiently high concentration of particles in the size range down to 0.03 μm to allow a statistically valid calculation of the fitness factor for such a low particle size. The ambient aerosol distribution curve measured by the SMPS system is shown in Figure 3.
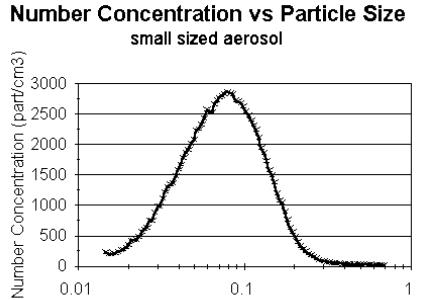
Figure 3
The results of the test with a small particle size distribution and a low fitness factor are shown in Figure 4.
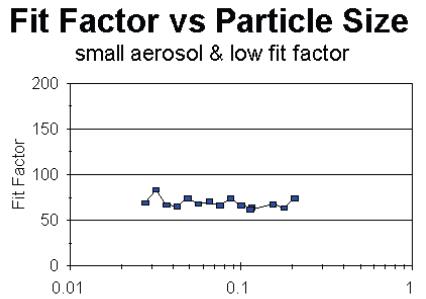
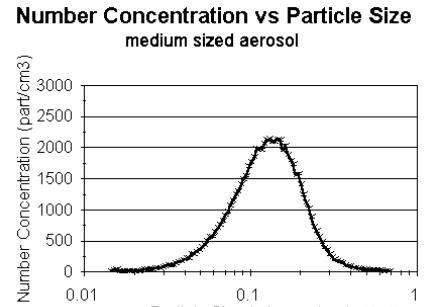
Figure 4 The results in Figure 4 show a linear relationship between the fitness factor and the particle size range of approximately 0.03-0.2 microns. The average fit factor value is 69 and the average deviation is less than 10%. The results for the smaller particle size distributions with higher fitness factors are shown in Figure 5 below. The results in Figure 5 show a linear relationship between the fitness factor and the particle size range in the size range of approximately 0.03-0.2 microns. The mean fitness factor is 355 and the mean deviation is less than 20%. The second ambient aerosol distribution is composed of larger particles with a peak distribution around 0.12 μm. The ambient aerosol distribution curve measured by the SMPS system is shown in Figure 6.
The results for the medium particle size distribution and the lower fit factor are shown in Figure 7 below.
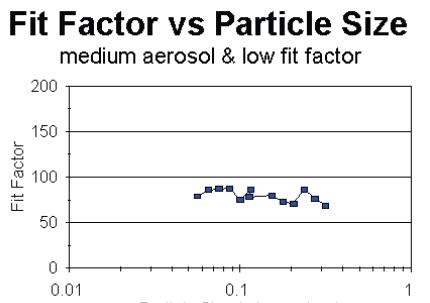
The results in Figure 7 show a linear relationship between the fitness factor and the particle size range from about 0.06 to 0.30 microns. The average fit factor value is 80 and the average deviation is less than 10%. The results for the medium particle size distribution and higher fitness factors are shown in Figure 8 below. Figure 8
The results in Figure 8 show a linear relationship between the fitness factor and the particle size range of approximately 0.06-0.3 microns. The average fit factor value is 302 and the average deviation is less than 15%. The final ambient aerosol distribution tested consisted of large particles with a peak distribution around 0.3 microns. The ambient aerosol distribution curve measured by the SMPS system is shown in Figure 9. Figure 9 The results of the large particle size distribution and lower fitness factor tests are shown in Figure 10 below. Figure 10 The results in Figure 10 show a linear relationship between the fitness factor and the particle size range of about 0.08-0.6 microns. The average fitness factor value is 110 with an average deviation of less than 15%. The results for the large particle size distribution and the higher fitness factor are shown in Figure 11.
The results in Figure 11 show a linear relationship between the fitness factor and the particle size range in the size range of approximately 0.08-0.6 microns. The mean value of the fitness factor is 303 and the mean deviation is less than 15%. Conclusions The results of the study indicate that ambient air particles in the range of 0.03-0.6 μm are suitable for quantitative respirator fit testing with particle counting instruments such as the TSI PORTACOUNT. Previous studies have shown that particles ranging from a few tenths of a micron to nearly 2 microns are equally suitable. Particles between 0.03 and 1 micron cover the full range of typical particle sizes found in ambient air1,10 (a statistically significant number) and are the same size as those detected by the PORTACOUNT. REFERENCES 1 Hounam, R.F. "A method for evaluating the degree of protection when wearing masks," Atomic Energy Research Institute, Harwell, U.K., AERE-R4125, 1962. 2 Schwabe, P.H. "Application of gases and aerosols to the measurement of seal leakage from respirators." International Symposium on Air Pollution Filtration and Respiratory Protection, Copenhagen, 1980. 3 Tuomi, T. "Facepiece Seal Leakage in Half Facepieces and Surgical Masks,". Journal of the American Industrial Hygiene Association 46:308-312 (1985). 4 Hinds W.C. and G. Kraske. "A study of the performance of dust masks with face seal leakage:an I. Experiment. " Journal of the American Industrial Hygiene Association 48(10):836-841 (1987) 5 Holton P.M., D.L. Tackett, and K. Willeke. "Particle-size-related leakage and aerosol loss in respirators." Journal of the American Industrial Hygiene Association 48(10):848-854 (1987). 6 Meyers, W.R., Hyunwook Kim, and Nani Kadrichu. "Effect of Particle Size on Respirator Facepiece Seal Leakage." West Virginia University MorgantownW.V. Prepared for the USAF College of Aeronautical Medicine by Brooks AFB. Dec. 1990.USAFSAM-TR -90-34. 7 Laye, Randolf. "Evaluation of a Miniaturized Condensation Particle Counter for Measuring Respirator Fit Factors" Journal of the International Association for Respiratory Protection. 1987 July-September 8 Tackett, D.L., "Evaluation of the TSIPORTACOUNT Quantitative Respirator Fit Test ”Shell Oil Company P.O. Box 4320, Houston, TX 77210. CAS8912501. 9 Rose, J.C., R.K. Oestenstad, and V.E. Rose, "Comparison of Portable Condensation Nucleus Particle Counter and Light Scattering Photometer Methods for Measuring Respirator Fit Factors&rdquo Occupational Applications and Environmental Health, 5(11), November 1990 10Biermann, A.H., R.A. da Roza, K.L. Foote, C.E. McCormack, C.R. Sackett, and S.R. Sawyer. LLNL "Evaluation of PORTACOUNT's Measurement of Respirator Fit Factors" Lawrence LLNL "Evaluation of PORTACOUNT's Measurement of Respirator Fit Factor Measurements," Lawrence Livermore International Laboratory, UCRL-CR-105696, October 1991. 11Kessler, R.C., "Acceptance Testing of the TSI PORTACOUNT Fit Verification System," Respiratory Protection Newsletter, RSAPublications, 6(6), November/December 1990. The TSI PortaCount Pro+ Fit Tester eliminates the guesswork, tedious and error-prone steps of traditional qualitative fit testing methods. When a respiratory protective mask needs to be tested for fit, it provides a quick and easy fit test that is fully compliant with OSHA standards and GB19083-2010 Technical Requirements for Medical Protective Masks, and is the only quantitative fit tester that can be used with all types of respirators, including N95 masks.
(ii) -Test procedure
(iii) -Results, conclusions
(The test results show that the fitness factor is a function of particle size for three different aerosol particle size distributions and for the fitness factor values calculated by each of the two methods. The fitness factors for each aerosol distribution were concentrated around 100 and 400. Due to the different variables in the test setup, the fitness factor for each test is not related to the other tests and should be considered separately. The fit factor is calculated by dividing the total number of particles outside the respirator for each particle size by the total number of particles inside the respirator for the same particle size. Therefore, if the SMPS system detects a particle count of 4 particles per cubic centimetre in the 0.05 μm-0.06 μm size range inside the respirator, and a particle count of 400 particles per cubic centimetre outside the respirator in the same size range, the fitness factor is calculated to be 100. The first ambient aerosol distribution consists of relatively small particles, with peaks in the range of 0.08 μm. micrometers or so. The ambient aerosol distribution has a sufficiently high concentration of particles in the size range down to 0.03 μm to allow a statistically valid calculation of the fitness factor for such a low particle size. The ambient aerosol distribution curve measured by the SMPS system is shown in Figure 3.

Figure 3
The results of the test with a small particle size distribution and a low fitness factor are shown in Figure 4.

Figure 4 The results in Figure 4 show a linear relationship between the fitness factor and the particle size range of approximately 0.03-0.2 microns. The average fit factor value is 69 and the average deviation is less than 10%. The results for the smaller particle size distributions with higher fitness factors are shown in Figure 5 below. The results in Figure 5 show a linear relationship between the fitness factor and the particle size range in the size range of approximately 0.03-0.2 microns. The mean fitness factor is 355 and the mean deviation is less than 20%. The second ambient aerosol distribution is composed of larger particles with a peak distribution around 0.12 μm. The ambient aerosol distribution curve measured by the SMPS system is shown in Figure 6.

The results for the medium particle size distribution and the lower fit factor are shown in Figure 7 below.

The results in Figure 7 show a linear relationship between the fitness factor and the particle size range from about 0.06 to 0.30 microns. The average fit factor value is 80 and the average deviation is less than 10%. The results for the medium particle size distribution and higher fitness factors are shown in Figure 8 below. Figure 8
The results in Figure 8 show a linear relationship between the fitness factor and the particle size range of approximately 0.06-0.3 microns. The average fit factor value is 302 and the average deviation is less than 15%. The final ambient aerosol distribution tested consisted of large particles with a peak distribution around 0.3 microns. The ambient aerosol distribution curve measured by the SMPS system is shown in Figure 9. Figure 9 The results of the large particle size distribution and lower fitness factor tests are shown in Figure 10 below. Figure 10 The results in Figure 10 show a linear relationship between the fitness factor and the particle size range of about 0.08-0.6 microns. The average fitness factor value is 110 with an average deviation of less than 15%. The results for the large particle size distribution and the higher fitness factor are shown in Figure 11.
The results in Figure 11 show a linear relationship between the fitness factor and the particle size range in the size range of approximately 0.08-0.6 microns. The mean value of the fitness factor is 303 and the mean deviation is less than 15%. Conclusions The results of the study indicate that ambient air particles in the range of 0.03-0.6 μm are suitable for quantitative respirator fit testing with particle counting instruments such as the TSI PORTACOUNT. Previous studies have shown that particles ranging from a few tenths of a micron to nearly 2 microns are equally suitable. Particles between 0.03 and 1 micron cover the full range of typical particle sizes found in ambient air1,10 (a statistically significant number) and are the same size as those detected by the PORTACOUNT. REFERENCES 1 Hounam, R.F. "A method for evaluating the degree of protection when wearing masks," Atomic Energy Research Institute, Harwell, U.K., AERE-R4125, 1962. 2 Schwabe, P.H. "Application of gases and aerosols to the measurement of seal leakage from respirators." International Symposium on Air Pollution Filtration and Respiratory Protection, Copenhagen, 1980. 3 Tuomi, T. "Facepiece Seal Leakage in Half Facepieces and Surgical Masks,". Journal of the American Industrial Hygiene Association 46:308-312 (1985). 4 Hinds W.C. and G. Kraske. "A study of the performance of dust masks with face seal leakage:an I. Experiment. " Journal of the American Industrial Hygiene Association 48(10):836-841 (1987) 5 Holton P.M., D.L. Tackett, and K. Willeke. "Particle-size-related leakage and aerosol loss in respirators." Journal of the American Industrial Hygiene Association 48(10):848-854 (1987). 6 Meyers, W.R., Hyunwook Kim, and Nani Kadrichu. "Effect of Particle Size on Respirator Facepiece Seal Leakage." West Virginia University MorgantownW.V. Prepared for the USAF College of Aeronautical Medicine by Brooks AFB. Dec. 1990.USAFSAM-TR -90-34. 7 Laye, Randolf. "Evaluation of a Miniaturized Condensation Particle Counter for Measuring Respirator Fit Factors" Journal of the International Association for Respiratory Protection. 1987 July-September 8 Tackett, D.L., "Evaluation of the TSIPORTACOUNT Quantitative Respirator Fit Test ”Shell Oil Company P.O. Box 4320, Houston, TX 77210. CAS8912501. 9 Rose, J.C., R.K. Oestenstad, and V.E. Rose, "Comparison of Portable Condensation Nucleus Particle Counter and Light Scattering Photometer Methods for Measuring Respirator Fit Factors&rdquo Occupational Applications and Environmental Health, 5(11), November 1990 10Biermann, A.H., R.A. da Roza, K.L. Foote, C.E. McCormack, C.R. Sackett, and S.R. Sawyer. LLNL "Evaluation of PORTACOUNT's Measurement of Respirator Fit Factors" Lawrence LLNL "Evaluation of PORTACOUNT's Measurement of Respirator Fit Factor Measurements," Lawrence Livermore International Laboratory, UCRL-CR-105696, October 1991. 11Kessler, R.C., "Acceptance Testing of the TSI PORTACOUNT Fit Verification System," Respiratory Protection Newsletter, RSAPublications, 6(6), November/December 1990. The TSI PortaCount Pro+ Fit Tester eliminates the guesswork, tedious and error-prone steps of traditional qualitative fit testing methods. When a respiratory protective mask needs to be tested for fit, it provides a quick and easy fit test that is fully compliant with OSHA standards and GB19083-2010 Technical Requirements for Medical Protective Masks, and is the only quantitative fit tester that can be used with all types of respirators, including N95 masks.




 Home
Home Product
 News
News phone
phone